
Introduction
Alkali metal thermal to electric converter (AMTEC) is an energy storage device for aviation deep-sea exploration equipment and ultra-long-distance power generation equipment [1-2]. Beta “-Al2O3 solid electrolyte tube (Beta alumina solid electrolyte tube) is a kind of sodium ion conductor, which is applied in AMTEC as electrolyte and affects the output power of AMTEC. The BASE tube is composed of β “-Al2O3 and β-al2o3, whose chemical formula of β” -Al2O3 is Na2O·5Al2O3 or NaAl5O8. The chemical formula of β-Al2O3 is Na2O·11Al2O3 or NaAl11O17 [3], but the conductivity of the former is tens of times that of the latter [4-5]. Therefore, increasing the content of β “-Al2O3 is beneficial to improve the conductivity of BASE tube.
At present, the manufacturing of BASE tube is generally divided into beta “-Al2O3 powder and BASE tube structure forming two parts. The most commonly used method for powder preparation of β “-Al2O3 is solid phase reaction method, in which high purity α-Al2O3, Na2O and a small amount of stabilizer are mixed and fired at high temperature to obtain β” -Al2O3 powder [6]. The active temperature range of α-Al2O3 to β “-Al2O3 is 1 200 ~ 1 500 ℃ [7], so the production of β” -Al2O3 can be regulated by temperature control.
The structure forming method of BASE tube is mostly pressing forming. According to the output characteristic equation of AMTEC, the impedance is proportional to the thickness of BASE tube and inversely proportional to the output current density [8-9]. Therefore, the output characteristics of AMTEC can be improved by reducing the thickness of BASE tube. However, it is difficult to achieve a thickness of less than 1 mm [10] for the existing pressing molding, which is difficult to meet the requirements of the thin-walled tubular structure of the BASE tube. Therefore, it is extremely urgent to explore and develop new molding technology.
3D printing technology has been paid attention by the battery manufacturing industry of energy storage equipment because its forming is not limited by mold. For example, ink-jet printing is used to produce capacitor anode [11] and battery solid electrolyte [12], and face exposure molding is used to produce dense zirconia electrolyte of fuel battery [13]. However, there are few relevant researches on 3D printing in BASE tube forming. In this paper, the surface exposure technology is proposed to manufacture BASE tube, and the preparation of special ceramic paste, printing molding process and phase conversion method are studied, which provides a new manufacturing means for BASE element and low cost rapid manufacturing of Na+ battery and alkali metal thermoelectric converter.
1 Materials and test methods
1.1 Preparation of special ceramic paste
In this paper, Al2O3 and ZrO2 composite ceramic powder with mass ratio of 7:3 is used as raw material. When preparing the slurry, the monomer, crosslinking agent, solvent and dispersant were mixed evenly by ball milling to form the premixed liquid. Then the ceramic powder was added to the premixed liquid in small amounts for several times for ball milling for 9 h. Finally, the photoinitiator TPO(2,4, 6-trimethylbenzoyl-diphenyl phosphine oxide) was added for ball milling again for 0.5 h. Finally, 45%(volume fraction) of the special ceramic paste.
1.2 Research on printing molding process
1.2.1 Measurement of photocuring parameters of special ceramic pastes
According to the Beer-Lambert theorem, the theoretical equation of single-layer curing thickness Cd of ceramic paste in surface exposure can be written as
![]()
Where, Cd is curing thickness; Dp is transmission depth; E is the exposure energy; EC is the critical exposure intensity.
Taking curing thickness Cd as Y axis and lnE as X axis, the curing curve of ceramic paste can be fitted, and then the photocuring performance parameters Dp and EC of ceramic paste can be obtained.
1.2.2 Selection of exposure parameters
The drawing of the curing curve of the slurry can only determine the minimum exposure parameter required by the slurry. When the selected exposure parameter is small, the slurry cannot be fully cured. When the selected exposure parameter is too large, the edge scattering phenomenon will be aggravated, affecting the molding accuracy. Therefore, in order to determine appropriate exposure parameters, the model shown in FIG. 1 is selected to test the selection of optimal exposure parameters. A1 ~ A11 is the Angle, S1-S6 is the area, L1 ~ L2 is the length, and Angle error sum, area error sum and length error sum are defined. 232 Chinese Journal of Mechanical Engineering, Vol. 57, No. 1, see Equations (2) ~ (4)

Where, Ai is the model value of each Angle (i=1,2···,11); A ‘i is the measurement value of each angular degree (i=1,2···,10); Sj is the model value of each area (j=1,2···,6); S ‘j is the measured value of each area (j=1,2···,6); Lk is the model value of each length (k=1,2); L ‘k is the measured value of each length (k=1,2).
The rationality of the selection of light exposure parameters is evaluated according to the gap between the print entity and the measurement model.
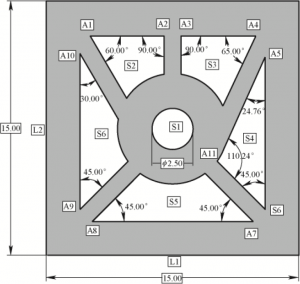
Figure 1 Optimal exposure parameter evaluation model
1.2.3 Research on firing process
The firing process includes degreasing process and sintering process. The purpose of degreasing process is to remove organic matter from the blank sample. In order to ensure the complete removal of organic matter, thermogravimetric analysis of the blank sample is required (TGA Netzsch TG, Germany). Thermogravimetric analysis can determine the law of the change of blank mass with temperature, and can work out the appropriate degreasing process. The purpose of sintering process is to densify the sample and increase the bending strength of the sample.
1.2.4 Performance characterization of sintered samples
Including three point bending test, phase analysis, EDS element analysis, microstructure detection, density detection. In this paper, the three-point bending strength test method for Fine Ceramics is adopted (GB/T6569 — 2006/ISO14704) : 2000), the sintered size is 29 mm×4 mm×3 mm, the test equipment is multifunctional statics testing machine (Xi ‘an Lichuang, PLD-5, China), the set span is 20 mm, the loading speed is 0.5 mm/min, a total of 15 samples, Welbull analysis was performed according to the bending strength test results. The phase was analyzed by X-ray diffractometer (XRD, D8 ADVANCE A25, Haomeng Technology, Germany). EDS for elemental analysis and microstructure observation enables emission scanning electron microscopy (su-8010, Japan); The density was measured by Archimedean drainage method.
1.3 Phase conversion process research
1.3.1 Research on optimal phase transition temperature
The traditional solid phase reaction method is to prepare β “-Al2O3 by reacting α-Al2O3 powder with sodium source at high temperature, and then directly forming BASE tube with β” -Al2O3 powder. In the preliminary test of this paper, the premixed liquid system in Section 1.1 was used to prepare β “-Al2O3 ceramic slurry. It was found that the slurry had serious caking phenomenon in the printing process and did not have printable property. Therefore, in this paper, the densified and sintered alumina and zirconia multiphase ceramics were converted at high temperature to generate conductive β “-Al2O3. Firstly, the optimal transition temperature was studied. In this paper, Na2O was used as sodium source, and five transition temperatures of 1 100 ℃, 1 200 ℃, 1 300 ℃, 1 400 ℃ and 1 500 ℃ were set. The production of β “-Al2O3 at different temperatures was calculated. To evaluate the effect of different phase temperature on the phase conversion effect.
1.3.2 Phase conversion results and conductivity test
The test of phase conversion results includes XRD test of samples after phase conversion, microstructure test, sample density measurement after phase conversion, bending strength measurement and precision measurement after phase conversion. For the convenience of clamping, φ7.5mm × 0.5mm impedance discs are used to test the conductivity of the materials. Before the test, conductive silver paste is applied on the surface of the sample as an electrode, and the high temperature dielectric temperature spectrum equipment made by the Laboratory of Electronic Ceramics Education Department of our school is used for testing.
2 Test results and discussion
2.1 Research on printing molding process
2.1.1 Drawing of curing curve of ceramic paste
The relationship between the light intensity parameter PWM value and the light power density P and the light energy density E in the test is shown in Table 2. The curing curve of the special ceramic paste obtained from the test is shown in Figure 2. The equation of the curve is Cd=56.5×ln (E/2.39), the critical exposure intensity Ec is 2.39 mJ/cm2, and the transmission depth Dp is 56.5 μm.
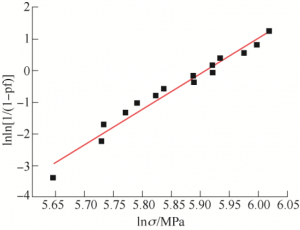
Figure 2. Curing curve of composite ceramic paste

Table 2 Relationship between optical PWM value and optical power density
2.1.2 Selection of exposure parameters
Figure 3 shows a multi-angle part printed with different exposure parameters. A confocal microscope (OLS4000, Japan) was used to measure the size difference between the printed sample and the CAD model. Table 3 shows the model values of each test content. The measurement Angle is A1 ~ A11, the area is S1 ~ S6, and the length is L1=L2= 15mm. Alumina and zirconia multiphase ceramic paste were respectively used with (80 PWM, 1.5 s), (90 PWM, 1.5 s), (70 PWM, 2 s), (80 PWM, 2 s), (90 PWM, 2 s) five exposure parameters, The Angle, area and length errors corresponding to different exposure parameters are shown in Figure 4. Under the same exposure time, the larger the PWM value is, the larger the error will be. When the PWM value is the same, the longer the exposure time, the greater the error. (70 PWM, 2 s) and (80PWM, 1.5 s), the Angle error sum, the area error sum and the length error sum are small, and the error difference of the two groups of exposure parameters is close. However, considering the printing efficiency, (80 PWM, 1.5 s) is preferred as the appropriate exposure parameter of alumina zirconia multiphase ceramic paste.
Table 3 CAD model values of Angle and area

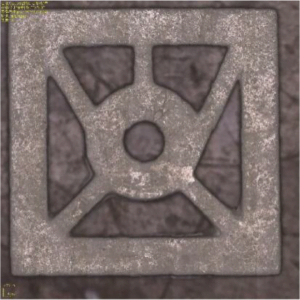
Figure 3 Multi-angle block confocal image
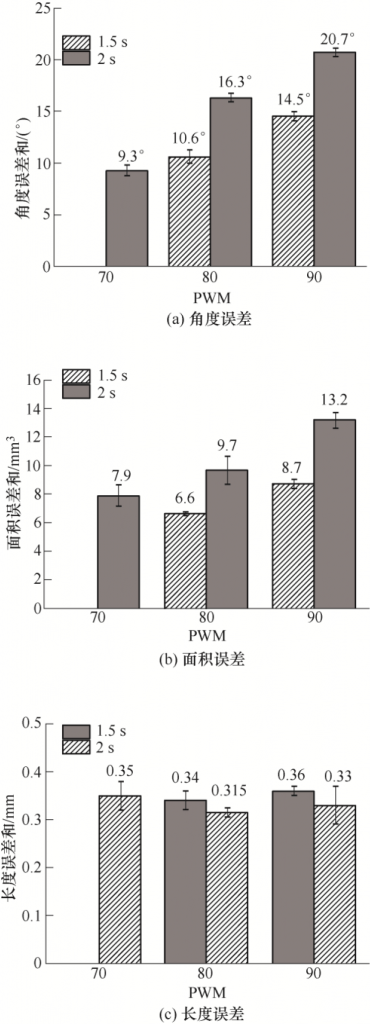
Figure 4 Test data of Angle, area and length
2.1.3 Study on degreasing sintering process
The TG curve of plain blank is shown in Figure 5. 200 ~ 600 ℃ is the mass change stage of plain blank, and 300 ~ 500 ℃ mass changes rapidly with a large change rate. At this stage, multiple insulation intervals should be set. In order to make the degreasing parts have a certain strength and convenient detection, the highest degreasing temperature is 900 ℃. The sintering process route is shown in Figure 6. In the degreasing sintering process, the sample size shrinks. In order to ensure the sample size after sintering, the linear shrinkage rate in X, Y and Z directions after firing process should be measured. The test results are shown in Figure 7. The shrinkage rates in X and Y directions are largely the same, 21.2% and 20.3%, respectively. The shrinkage rate in Z direction was 23.6%. Under the premise that the slurry, printing parameters, printing equipment and post-processing technology are consistent, the amplification coefficients used in X, Y and Z directions are 1.269, 1.255 and 1.309.
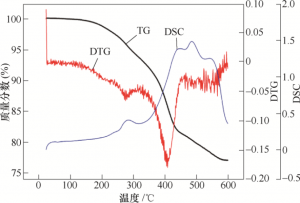
FIG. 5 Thermogravimetric curve of blank
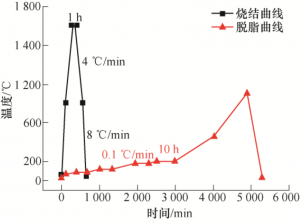
Figure 6. Debating-sintering curve of plain blank
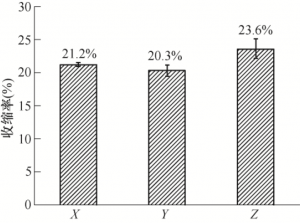
FIG. 7 Shrinkage of XYZ after three-direction sintering
2.2 Characterization of sample properties after densification and sintering
2.2.1 Three-point bending strength after sintering
The three-point bending strength of alumina zirconia multiphase ceramics after densification and sintering can be calculated by equation (5) [14]
![]()
Where, F is the maximum force when the sample is damaged, L is the distance between the two fulcrums of the supporting sample, B is the width of the sample, and H is the thickness of the sample. According to the bending strength test method of fine ceramics (GB/T 6569 — 2006), the sample size was 29 mm×4 mm×3 mm, the span was 20 mm, the acceleration was 0.5 mm/min, and the number of tests was 15. The calculated bending strength of the sample is 352.0 MPa± 37.5MPa. In order to confirm the stability of the bending strength of the sample, Welbull analysis was performed on the data, as shown in Figure 8, and the equation of the fitting curve was

Where, Pf is the failure probability, and the slope of the equation m is the stability coefficient of the sample strength. The larger the value, the higher the stability. The stability coefficient of three point bending is 11.23.
FIG. 8 Fitting diagram of Welbull analysis
2.2.2 Phase detection
The phase change of the sample before and after sintering is shown in Figure 9a. Al2O3 did not have phase change before and after sintering, and ZrO2 changed from monoclinic phase to tetragonal phase. The elemental analysis after sintering is shown in Figure 9b. There are only three elements, Al, O and Zr, and no other impurities in the sample, indicating that the organic matter in the blank can be completely removed by firing.
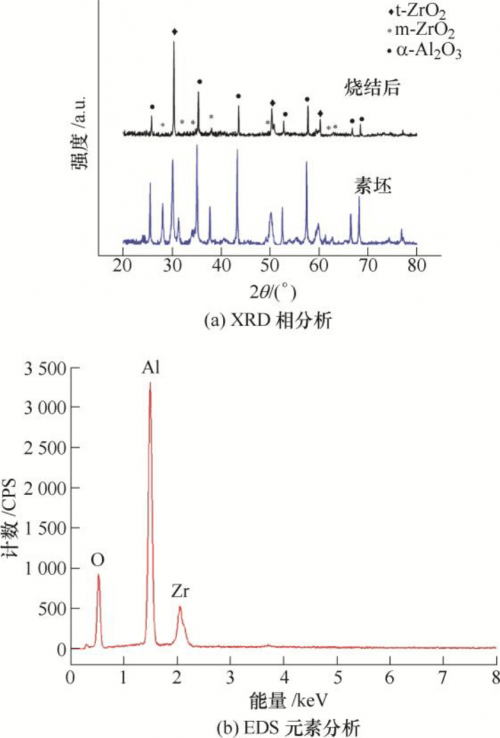
FIG. 9 Material analysis after densification and sintering
2.2.3 Observation of microstructure
The electron microscopic images of the surface and fracture surface of the sintered ceramic sample are shown in Figure 10. Al2O3 and ZrO2 are uniformly dispersed, and Al2O3 is a dark grain with a particle size less than 1μm. ZrO2 has light grain size less than 0.5 μm. As can be seen from FIG. 10b, the fracture form is transgranular fracture, and the two ceramic particles are arranged in a compact arrangement without obvious porosity and defects.
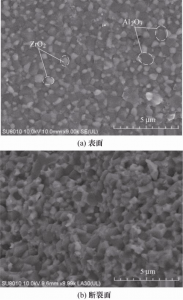
FIG. 10 SEM image of densified sintered ceramic standard parts
2.3 Phase conversion process research
2.3.1 Study on the maximum phase transition temperature
Phase conversion is the conversion of non-conductive α-Al2O3 to conductive β “-Al2O3. The sintered alumina and zirconia multiphase ceramic parts were coated in embedded powder and reacted at high temperature. The process route of phase transformation is shown in Figure 11.
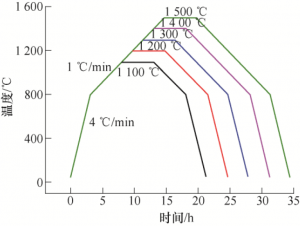
FIG. 11 Phase conversion process diagram
2.3.2 β “-Al2O3 phase detection and content calculation
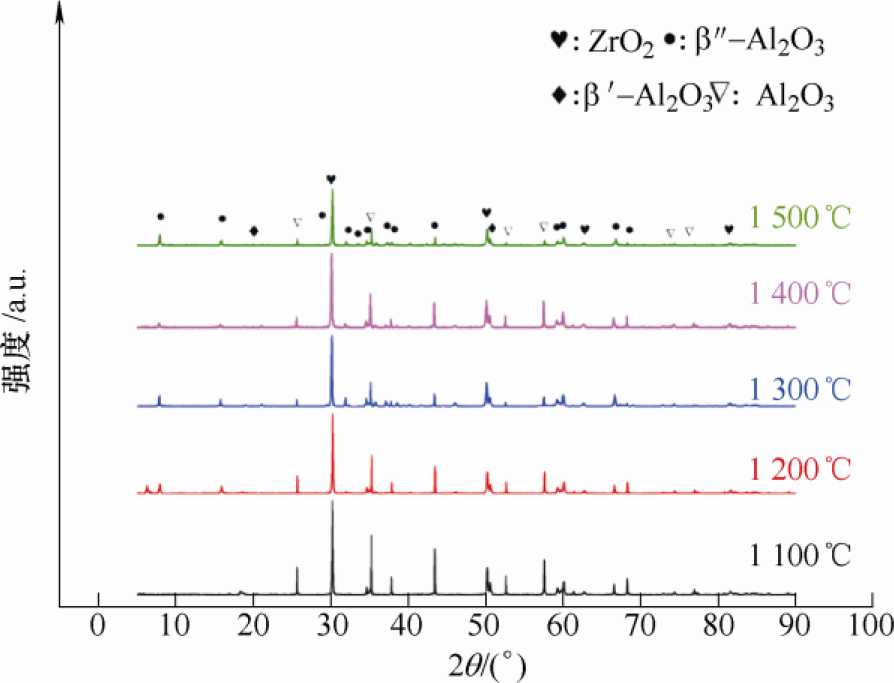
The samples after phase conversion were tested by XRD and the β-al2o3 generation after phase conversion process was calculated according to the analysis results. XRD of the sample after phase conversion is shown in Figure 12. As can be seen from FIG. 12, β/β “-Al2O3 was formed at different phase transition temperatures, and the phase of ZrO2 remained t-ZrO2 without changing the phase transition. The phase content is calculated by the relative intensity of the corresponding characteristic peak, and the calculation formula is shown as formula (7) ~ (12)[15-16].

Where, Iα(104) and Iα(113) represent the XRD peak intensity of α-Al2O3(104) crystal plane and (113) crystal plane. Iβ (104), Iβ (206), and Iβ (107) represent the XRD peak intensity of β-Al2O3(102), (206) and (107) crystal planes, Iβ “(0111) and Iβ” (2011) represent the XRD peak intensity of β “-Al2O3 (0111) crystal plane and (2011) crystal plane. Based on the above formula and XRD, the relative content of Al2O3 in different phases can be calculated. The calculated results can be seen in Table 4. The content (mass fraction) of β “-Al2O3 increases with the increase of phase transition temperature, and the highest content is 80.5% at 1 500 ℃. The thin-walled BASE tube after phase transformation is shown in Figure 13, with wall thickness of 0.5mm, 0.8mm and 1.0mm successively from left to right.

Figure 12 XRD pattern after phase conversion
Table 4 Mass fraction (%) of Al2O3 at different phase transition temperatures

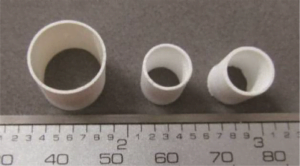
FIG. 13 Thin-walled BASE tube after phase conversion
2.3.3 Observation of microstructure The microstructure of samples after phase transformation is shown in FIG. 14. Samples before and after phase transformation are very different in terms of microstructure. Obvious short rod-like grains appeared at 1 400 ℃ (as shown by the arrow in the figure), and the short rod-like grains were more obvious at 1 500 ℃, indicating that a large amount of β “-Al2O3 was formed at the phase transition temperature of 1 500 ℃. The results of electron microscopy and XRD are basically consistent.
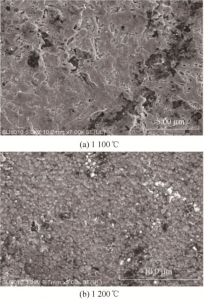
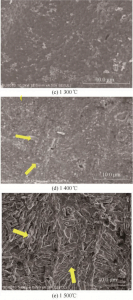
FIG. 14 SEM images of the samples after phase transformation at different temperatures
2.3.4 Sample density Measurement after phase conversion The theoretical density of Al2O3 powder and ZrO2 powder used in this paper is 3.97g /cm3 and 6.08g /cm3, and the calculated theoretical density of sintered parts is 4.43g /cm3. The average density measured by Archimedean principle is 4.22g /cm3, and the relative density is 95.3%. The density of the sample after phase transformation is shown in Table 5. With the increase of phase transformation temperature, the density decreases, so the phase transformation process will result in a decrease in density.
Table 5 Density and density at different phase transition temperatures

2.3.5 Study on bending strength and dimensional accuracy of samples after phase transformation
According to the three-point bending strength test method in 2.2.1, the bending strength of the sample after phase transformation is 261.5MPa ± 37.2MPa. By comparing the data tested in 2.2.1, as shown in Figure 15, the three-point bending strength of samples before phase transformation is 352.0MPa ± 37.5MPa, and that of samples after phase transformation is 261.5MPa ± 37.2MPa (the test span is 20 mm, The loading rate is 0.5 mm/min), indicating that the bending strength of the sample decreases after the phase transformation process. However, the average three-point bending strength of the BASE sample made by scholars of Northwest Institute of Nuclear Technology in 2016 was 230MPa after the doping mass fraction was 0.4% TiO2 [14]. The bending strength of ZrO2 and TiO2 co-doped BASE sample made by scholars of Shanghai Institute of Ceramics in 2016 was 192 MPa[17]. Therefore, although the bending strength of the sample manufactured by the surface light source photocuring technology will be reduced after the phase transformation process, its mechanical properties are not inferior to those of the traditional process.
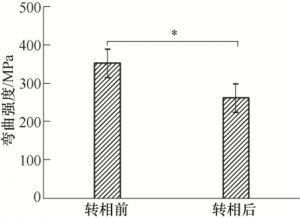
FIG. 15 Comparison of three-point bending strength of samples before and after phase transformation (*P < 0.05)
In terms of molding accuracy, the average size of samples in X, Y and Z directions before phase conversion is 29.2mm ± 0.1mm, 3.1mm ± 0.1mm, 4.0mm ± 0.1mm, respectively. The average size of the sample in XYZ direction after phase conversion is 29.5 mm ± 0.2mm, 3.2 mm ± 0.1 mm, 4.2 mm ± 0.1 mm, respectively. After the phase conversion process, the linear size of the samples in the three directions increased, but the fluctuation of the standard deviation σ was very small. The comparison of data is shown in Table 6. Therefore, in order to ensure the dimensional accuracy of the sample after phase transformation, the linear size should be adjusted appropriately according to the dimensional variation in each direction on the printing model to offset the dimensional error caused by the phase transformation process.
Table 6 Size comparison before and after phase conversion (mean ± standard deviation σ)

2.3.6 AC impedance detection and conductivity calculation
The test temperatures were 200 ℃, 300 ℃, 400 ℃ and 450 ℃ respectively, and the scanning frequency range was 100 Hz ~ 2 MHz. The equivalent circuit diagram shown in Figure 16 can be obtained by fitting the collected impedance data points with Zview software.
The AC impedance spectrum at 200 ~ 450 ℃ is shown in FIG. 17. The horizontal axis of the curved line is Z ‘, representing the real part of the impedance, and the vertical axis is -Z “, representing the negative of the imaginary part of the impedance. The AC impedance spectrum of the electrolyte consists of a semicircle of the high frequency part and a straight line of the low frequency part [18,19], and the total resistance R can be expressed by equation (13)
![]()
Where, Rg is the grain resistance value of electrolyte and represents the intersection point of the high frequency circular arc and the horizontal axis, corresponding to the R1 resistance value of the equivalent circuit diagram in Figure 16, and Rgb is the grain boundary resistance value of the electrolyte and represents the straight diameter of the arc, corresponding to the R2 resistance of the equivalent circuit diagram in Figure 16. The linear portion of the low frequency end represents the electrolyte-electrode interface capacitance CPE.
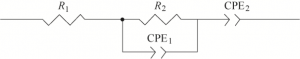
Figure 16 Equivalent circuit diagram
According to the research of XU et al., the grain boundary resistance and grain resistance of β “-alumina solid electrolyte decreased with the increase of test temperature [20]. Data fitting in this paper is shown in figure 17 and shown in table 7, grain boundary resistance decrease with the temperature increasing of test, between 200 ~ 400 ℃, and the grain size of the sample resistance decrease with the increase of temperature, but the 450 ℃, the larger 8.2 grain resistance, because the sample of pore, crack defects, etc. These defects affect the ion migration rate and the grain resistance of the electrolyte [21]. The variation trend of grain resistance in this paper is slightly different from that in other literatures, but the variation trend of overall resistance is the same.
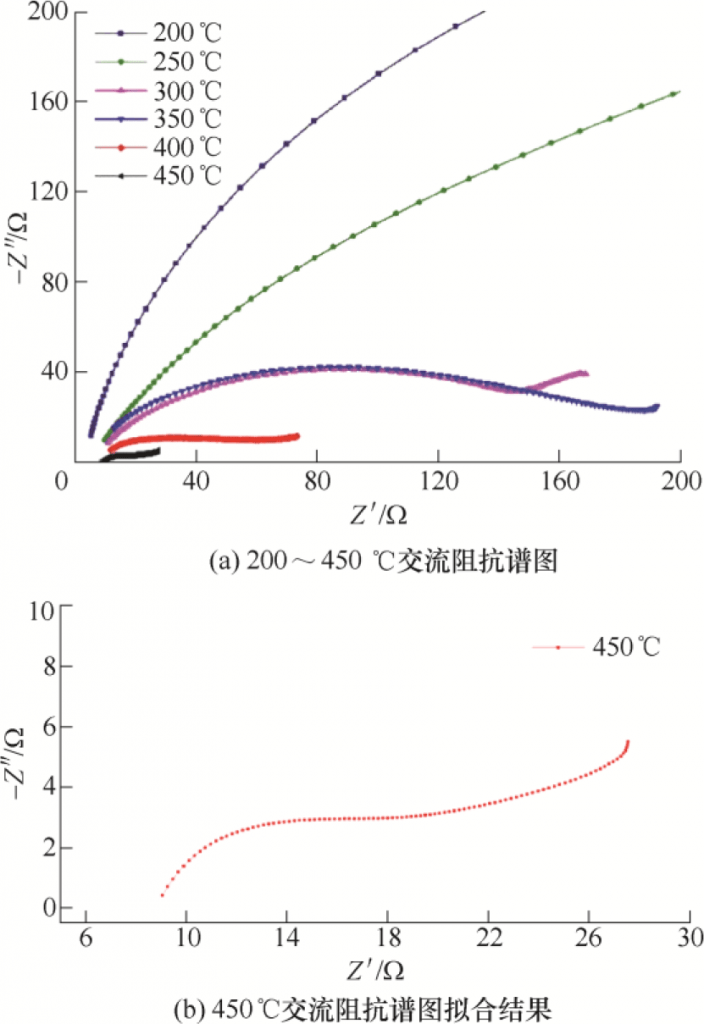
FIG. 17 AC impedance spectrum
Table 7 Resistance and ionic conductivity at different temperature segments

According to the fitting results, the total electrolyte resistance R and the conductivity σIC for each temperature segment can be calculated, as shown in Equation (14).

Where, σIC is the conductivity of electrolyte; LT is the sample thickness; S is electrode area; R is the total electrolyte resistance.
The calculated results of ionic conductivity at each temperature range are shown in Table 7.
Compared with other research institutions, the traditional powder solid phase reaction method was used. For example, in 2017, scholars from Pohang University of Science and Technology in South Korea produced BASE wafers doped with Fe2O3 and TiO2, and the measured conductivity was (6.8×10⁻³ ~ 1.6×10⁻¹)S/cm[3]. In 2016, scholars from Northwest Institute of Nuclear Technology produced BASE wafer doped with TiO2, and its tested conductivity was (4.2×10⁻² ~ 6.8×10⁻¹)S/cm[14]. In 2015, scholars of Wuhan University of Technology used Y2O3 doped BASE wafer, whose tested conductivity was (5.7×10⁻³ ~ 3.48×10⁻²)S/cm[22]. Sol-gel method is used, such as BASE wafer made by scholars of Nanjing University of Technology in 2010, whose tested conductivity is (3.16×10⁻⁵ ~ 2.6×10⁻²)S/cm[19]. In this paper, the tested conductivity of Zro2-doped BASE wafer based on surface light source photocuring technology is (3.43×10⁻⁴ ~ 7.83×10⁻³)S/cm, and its electrical performance is comparable to that of the above traditional process.
3 Conclusion
A method for preparing β “-Al2O3 solid electrolyte tube by surface light source photocuring technology was proposed, and a special Al2O3-ZrO2 composite ceramic slurry for thin-wall β” -Al2O3 solid electrolyte tube with a critical exposure intensity of 2.39 mJ/cm2 was provided. The transmission depth Dp is 56.5 μm. Through the multi-angle block model to determine 80 PWM, 1.5 s is the appropriate exposure parameter of the slurry, through the thermogravimetric analysis to formulate the firing process curve, the sintered sample after the three-point bending strength of 352.0 MPa ± 37.5MPa, the density of 95.3%. The sample prepared at 1 500 ℃ has 80.5% β “-Al2O3 production, 7.83×10⁻³ S/cm ionic conductivity and 261.5 MPa ± 37.2MPa three-point bending strength.