
Since entering the 21st century, energy issues have become the focus of attention all over the world. As a new type of energy storage battery, sodium-sulfur battery has become a research hotspot due to its advantages of high specific energy, high discharge power, no self-discharge, low cost, no pollution, etc. The performance of sodium-sulfur battery depends on the properties of its solid electrolyte β”-Al2O3. Therefore, the preparation and properties of β”-Al2O3 electrolyte have gradually become the research field of attention.
β”-Al2O3 is a complex sodium-aluminum composite oxide with the empirical formula Na2O·5.33Al2O3, and it also has another isomer β-al2o3 with the empirical formula Na2O·11Al2O3. The electrical conductivity of β-Al2O3 is 10 times that of β-Al2O3, but there are always two crystalline phases β-al2o3 and β-al2o3 in Na2O-Al2O3 system, and in the sintering process at high temperature, The β”-Al2O3 phase is very easy to transform to the β-al2o3 phase, so it is difficult to prepare solid electrolysis materials with high content of β”-Al2O3 phase.
The main method for the traditional synthesis of β”-Al2O3 is to mix high purity α-Al2O3, Na2CO3 and a small amount of stabilizer such as MgO or Li2O, etc., and sintered at a high temperature above 1 580℃. This method uses high purity α-Al2O3 raw materials, which makes the cost high. In recent decades, there have been some reports on the preparation of β”-Al2O3 by using new chemical methods such as sol-gel method, alcohol-brine method, solvent combustion method, coprecipitate method, etc. These synthetic methods have the advantages of high purity of the finished material, uniform distribution and low sintering temperature. However, compared with traditional solid phase method, its synthesis process is more complicated, with higher equipment and operation requirements, and it is difficult to industrial large-scale production. In addition, since Na2O is extremely volatile during sintering at high temperature, no matter the traditional solid phase method or the new chemical method is adopted to prepare β”-Al2O3, in order to ensure the performance of ceramics after sintering, it is often necessary to bury the blank in the pre-synthesized precursor during sintering, which greatly increases the production cost.
The solid phase synthesis method is adopted, using low cost industrial grade α-Al2O3(purity is 82.90%, main impurity is crystal water) as the raw material. Meanwhile, the burial-sintering process is improved, and the burial-sintering material is divided into two parts, one part is a small amount of pre-synthesized precursor, the other part is a large number of industrial grade α-Al2O3, so as to reduce the burial-sintering cost. The influence of sodium content and sintering system on β “-Al2O3 phase content was explored, and the formulation and sintering system with better performance were obtained. The preparation method has a low cost and is easy to be mass-produced in industrialization, and has good application value.
1 Experiment
1.1 Sample preparation
Industrial Al2O3, analytical pure Na2CO3 and analytical pure Li2CO3 were used as raw materials in accordance with the stoichiometric ratio of Na1.67(1+x)Li0.33Al10.67O17(x= 0,0.10, 0.15, 0.20). The measured raw material was placed in the ball mill tank, and anhydrous ethanol and ZrO2 ball mill were used as the ball mill medium for 12 h. After drying, the ball-milled slurry is pre-roasted for 2 h at 1 100℃, and the pre-milled powder is coarsely ground with a mortar and placed in a ball mill tank for 12 h, and then dried. After sifting, it is granulated by adding polyvinylbutyrate (PVB) binder with a mass fraction of 3%. Isostatic press is pressed down to make a cylinder with a diameter of 13mm and a thickness of about 1.3mm. After the glue is discharged, it is calcined at different sintering temperatures, held for 30min, and cooled to room temperature with the furnace.
1.2 Sample characterization
S-4800 field emission scanning electron microscope was used to observe the morphology of the sample, and the working voltage was 3 kV. AXS D8 ADVANCE X-ray diffractometer (XRD) was used to detect the crystal phase composition of the samples. The working voltage was 40 kV, the current was 40 mA, the Cu Kα(λ=0.154 18 nm) and the scanning Angle was 5°~70°. A DT-50 thermal analyzer (SHIMADZU, JAPAN) was used to detect the thermal-physical properties of the powder after a ball milling. The heating rate was 10 ℃/min in helium atmosphere, and the temperature range was from room temperature to 1 400 ℃. The electrical conductivity of the sample was tested on CHI604C electrochemical testing station by AC impedance spectroscopy. Silver electrodes were burned on both sides of the sample after polishing, and silver wires were used as electrode leads. The test temperature range was 250~700℃, the test frequency range was 10-1 ~105 Hz, and the AC input signal was 10mV.
2 Results and discussion
2.1 Thermophysical performance analysis
In order to study the thermophysical transformation of powder at different temperatures, the powder with x=0.15 after one ball milling was tested by differential thermogravimetric weight (TG-DTA), as shown in FIG. 2. As can be seen from Figure 2, there is an obvious endothermic peak at 110.8℃, accompanied by severe mass loss on the TG curve, which can be attributed to volatilizing of free water and residual ethanol. At 224.4 ℃, a tiny endothermic peak appeared, accompanied by a rapid reduction in mass, which may be caused by dehydration of a small amount of crystallizing water in the raw material. At 345.6 ℃, an obvious exothermic peak appeared, accompanied by a decrease in mass, which may be caused by the combustion of organic matter such as ethanol remaining in the powder. There is an obvious endothermic peak at 740.9 ℃, accompanied by a rapid reduction of mass, which is caused by the decomposition of Na2CO3 and Li2CO3 into Na2O and Li2O and the release of CO2. Within the range of 900 ~ 1 250 ℃ has a slow exothermic peak, mass loss and the unknown, this is due to the alpha Al2O3 and Na2O, beta ʺ Li2O reaction – Al2O3, beta Al2O3, NaAl5O8 and LiAl5O8 caused by. In addition, it can be seen from the TG curve between 800 and 1 400℃ that although the mass loss is not obvious, it can still be observed that the mass loss is slow and uniform, and the mass loss is about 1.21%, which can be attributed to the volatilization of Na2O. Due to the low mass loss, no endothermic peak is observed. Because TG – DTA analysis has a certain lag; Meanwhile, according to other relevant literature, the pre-firing temperature was set at 1 100 ℃.
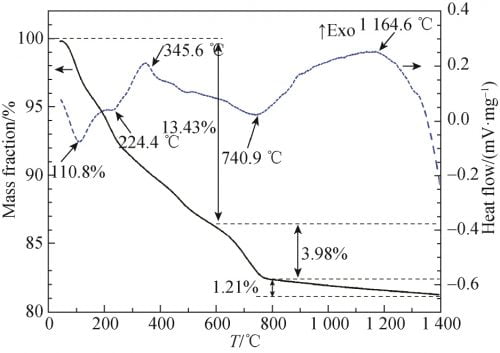
Fig. 2 TG and DTA curves of Na1.67(1+x)Li0.33Al10.67O17(x=0.15) ceramics raw material
2.2 XRD Analysis
FIG. 3 shows the XRD spectra of the precursor prepared by different formula powders after pre-firing at 1 100 ℃. As can be seen from the figure 3, all samples are observers to betaʺ-Al2O3 and NaAl5O8 characteristic peak, and were not observed alpha Al2O3 and beta Al2O3 phase diffraction peak, indicated that the presintering temperature, alpha Al2O3 has almost completely reaction of raw materials, and beta phase, and so at this time Can not be observed in XRD pattern; At the same time, there are three unknown peaks in the XRD pattern, which may be some complex Na, Al, O compounds. When x = 0 and x = 0.1 betaʺ-Al2O3 and XRD spectrum NaAl5O8 phase wide of the diffraction peak, diffraction peak intensity is low, that product crystallinity is not high; When the x value gradually increase to 0.15 and 0.20, betaʺ-Al2O3 and NaAl5O8 characteristic peak significantly increased and sharp, shows that with the increase of Na2O, powder presintering crystallinity increase after phase development more hasten is perfect.
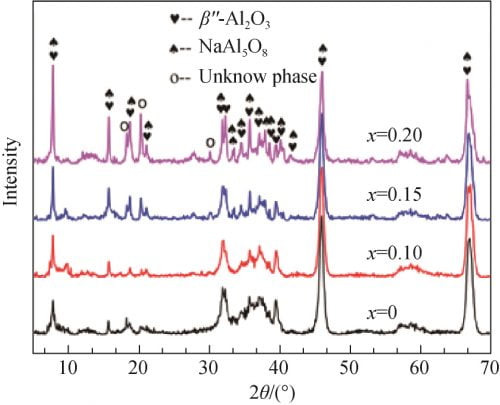
Fig. 3 XRD spectra of precursor powders calcined at 1 100 ℃
Figure 4 for the different precursor formula after the tablet sample preparation after 1 580 ℃ calcination of XRD spectrum and betaʺ-Al2O3 and beta Al2O3 standard atlas. From figure 4, you can see that all the samples are for betaʺ-Al2O3 and beta Al2O3 phase, and as the x value, namely the increase of the content of Na2O characteristic peak in the betaʺ-Al2O3 theta 2 = 45.9 ° peak strength is increased after the first small reduction trend. Theta select 2 = 44.5 ° respectively (beta Al2O3) and theta 2 = 45.9 ° (betaʺ-Al2O3) characteristic peak, according to the type (1) [12] to calculate the beta ʺ – the relative content of Al2O3 phase, the results are shown in table 1. From table 1 shows, the relative content of betaʺ-Al2O3 phase with the increase of amount of Na2O contain in the recipe showed a trend of increased after decreased first and biggest x = 0.15, 97.19%; When Na2O content slightly raised to x = 0.20, betaʺ-Al2O3 sharply reduced to 75.66%, the relative content of Al2O3 phase can be observed at this time obvious diffraction peak beta Al2O3 phase (see figure 4, x = 0.20, 2 theta equals 44.5 °), this may be due to Na2O content is too high, Cause presintering generated when NaAl5O8 too much, and there is not enough when sintering LiAl5O8 reacts with betaʺ-Al2O3 phase, resulting in more beta Al2O3 phase.

Among them: I beta, I betaʺ characteristic peak intensity of beta-Al2O3 and betaʺ-Al2O3.
Table 1 β” phase relative content of different formulas of samples after calcination at 1 580 ℃
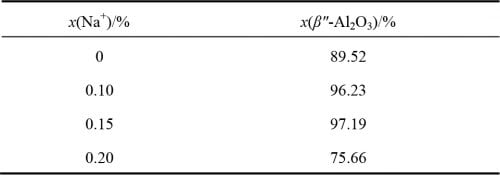
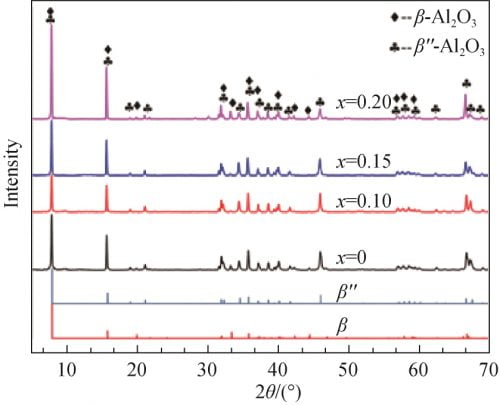
Fig. 4 XRD patterns of each samples calcined at 1580℃
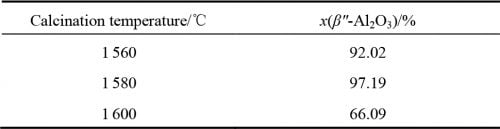
FIG. 5 shows the XRD spectra of x=0.15 samples calcined at 1 560, 1 580 and 1 600 ℃. Using the type (1) the same method to calculate beta ʺ – the relative content of Al2O3 phase, as shown in table 2. By figure 5 by combining the characteristic peak amplification contrast can be seen in table 2, in 1 560 ℃ sintering, sample beta ʺ – Al2O3 phase corresponds to the characteristics of the diffraction peak intensity are lower and half peak width wider, illustrate the crystallinity is not high, but the relative content of betaʺ-Al2O3 phase is higher, at 92.02%. In 1 580 ℃, the highest intensity of the diffraction peak and sharp, show that the temperature, the crystallinity of crystal, best betaʺ-Al2O3 content is the highest, 97.19%; In 1 600 ℃, there is an obvious beta Al2O3 phase characteristic peak (2 theta = 44.5 °), beta ʺ – the relative content of Al2O3 phase also dropped to 66.09%. This may be caused by two reasons, one is increased as the temperature further, betaʺ-Al2O3 beta Al2O3 phase shift. Second, with the increase of temperature, the volatilization of Na2O becomes more and more intense, which leads to the transformation of samples to β-Al2O3 phase with less Na content.
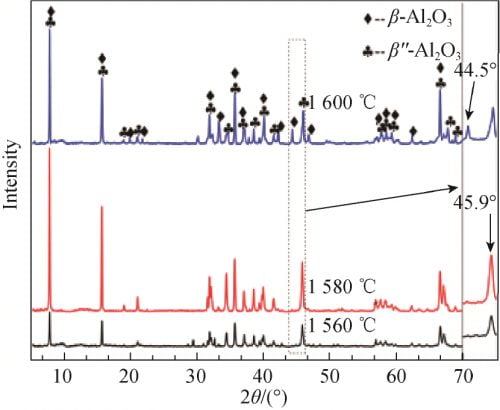
Fig. 5 XRD patterns of Na1.67(1+x)Li0.33Al10.67O17(x=0.15) ceramics calcined at different temperatures
2.3 Microstructure analysis
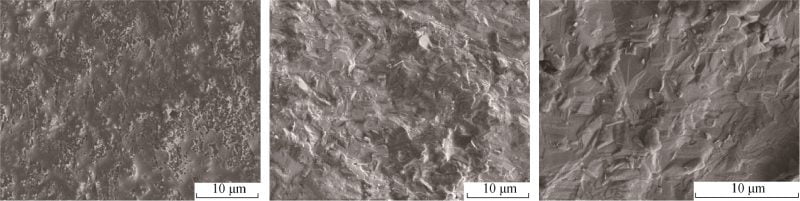
Fig. 6 SEM image of sample cross–section at different sintering temperatures for Na1.67(1+x)Li0.33Al10.67O17 (x=0.15) ceramics
FIG. 6 shows SEM photos of x=0.15 samples after calcination at different temperatures. It can be seen from Figure 6a that the sample still has a small number of pores after calcination at 1 560 ℃, and a large number of molten substances can be observed. Combined with Figure 4, it can be seen that the crystallinity of the sample is low at this time. As can be seen from Figure 6b, after the sample is calcined at 1 580℃, the grain size on the surface of the sample is small, there is a small size gap between grains, and the grain boundary is obvious. Can be seen from the figure 6 c, 1 600 ℃, nearly has not observed the existence of the grain boundary, the crystal density, but the combination of figure 5 and table 2 shows that the beta ʺ temperature degrees – the relative content of Al2O3 phase minimum instead, this is very adverse to the conduction of Na +.
Table 2 x=0.15 formulas at different sintering temperatures and β” phase relative content
2.4 Conductivity analysis
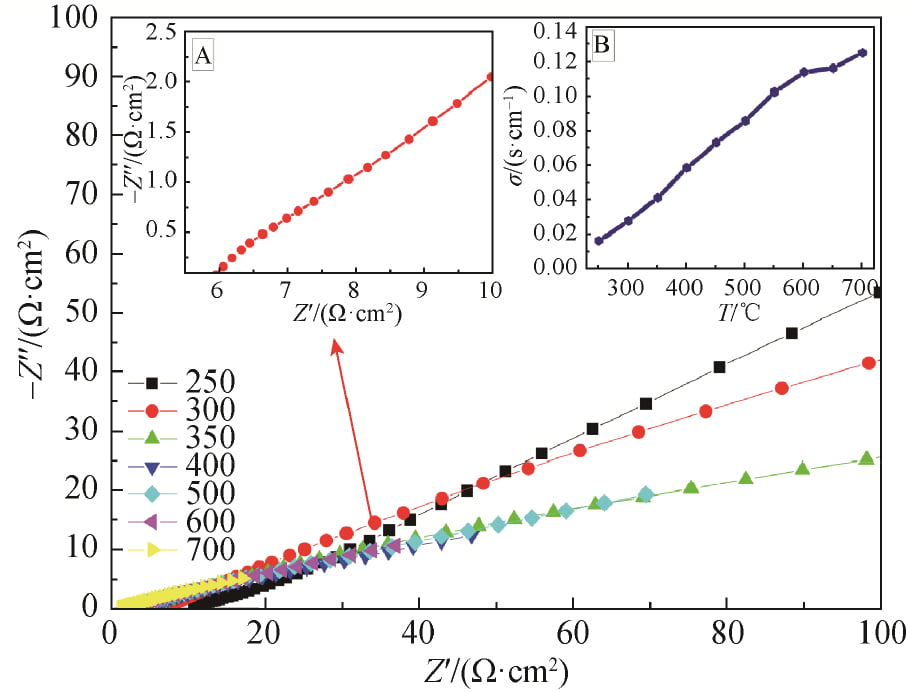
The AC impedance maps of x=0.15 samples sintered at 1 580 ℃ were tested by AC impedance meter at different temperatures, as shown in FIG. 7. The AC impedance spectrum at 300 ℃ is shown in FIG. 7, FIG. A, and the conductivity at different temperatures is obtained in FIG. 7, FIG. B. As can be seen from Figure 7, the conductivity of the sample gradually increases with the increase of temperature, and the conductivity of the sample at 300℃ is 0.028S /cm.
2.5 Analysis of conductive mechanism
The correlation between conductivity and temperature is derived from Arrnhenius theory, and the results are shown in Equation (2). Where: A is the characteristic constant; R is the molar gas constant; Ea is the conduction activation energy, including defect formation energy and ionon migration energy. Logarithms were taken from both sides of Equation (2) to obtain Equation (3), and electrical conductivity at different temperatures was substituted into Equation (3) to obtain the correlation curve between electrical conductivity and temperature of the sample, as shown in Figure 8. As can be seen from Figure 8, the curve is almost linear, and thus the conductance activation energy of the crystal is calculated as Ea= 0.259eV.

Fig. 7 Impedance spectra of Na1.67(1+x)Li0.33Al10.67O17(x=0.15) ceramics at 250–700℃


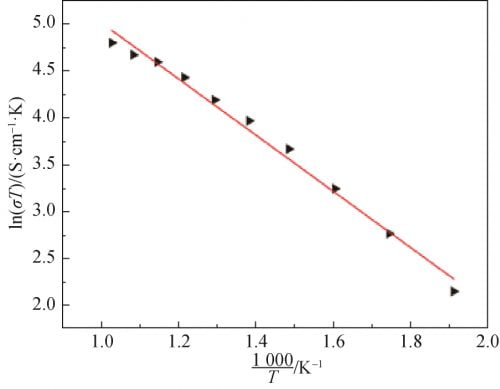
Fig. 8 Relationship of Na1.67(1+x)Li0.33Al10.67O17(x=0.15) ceramics between conductive and temperature
According to the AC impedance Measured value of the sample measured at 300 ℃ and referring to the research results of Zhu et al., the equivalent circuit model was plotted as shown in the illustration in Figure 9. Fitted with zsimdemo software, Fitted value was obtained, as shown in Figure 9. Compared with two spectral lines, the two lines almost overlap, indicating that the equivalent circuit model is close to the actual circuit. In the equivalent circuit model, L1(Inductance due to silver wire and silver electrode) and R0(Lead wire resistance) are inductance and resistance of silver wire and silver coating, respectively. CPEg(grain capacitance) and Rg(grain resistance) are the capacitance and resistance of the grain, respectively. CPEgb(grain boundary) and Rgb(grain boundary resistance) are capacitance and resistance of grain boundaries, respectively. CPEdl(a double layer capacitance). Capacitance. The Rct(charge transition resistance) is the charge transfer resistance. Due to the nature of the polycrystalline ceramic electrolyte, the pure capacitor is replaced here by a corner vector element (CPE).
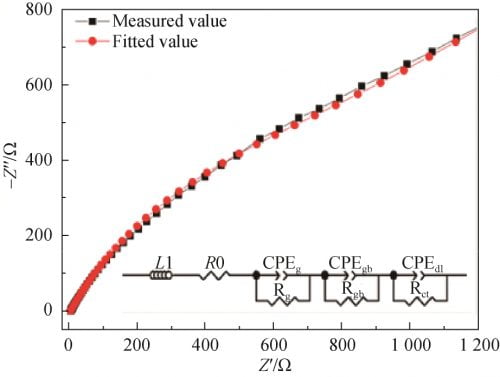
Fig. 9 Fitting circuit impedance spectra of Na1.67(1+x)Li0.33Al10.67O17(x=0.15) ceramics at 300℃
3 Conclusion
1) 1 100 ℃ presintering has formed part of the betaʺ-Al2O3, and formula Na1.67 (1 + x) Li0.33 Al10.67 O17 the Na content is higher, the betaʺ-phase of Al2O3 phase development more perfect.
2) The relative content of betaʺ-Al2O3 phase and formula Na1.67 (1 + x) Li0.33 Al10.67 O17 the Na content is closely related to the synthesis temperature, ceramic, sintering temperature for 1, 580 in x = 0.15 ℃, the betaʺ-phase to the highest levels of Al2O3 phase, At this time, the microstructure of the ceramics is relatively dense, the conductivity is 0.028 S/cm and the activation energy is 0.259 eV at 300 ℃.